
চক্রের মূলনীতি
Bitcoin bull bear cycle বাংলা: real data ও 4-phase analysis
Coin Metrics ও CoreCharts free data দিয়ে price structure, MVRV, NUPL, active address ও LTH/STH হিসাব করুন; 2019–2022 replay থেকে phase, contrary evidence ও invalidation লিখুন।
Bitcoin market-কে bull ও bear—দুই label-এ বলা সহজ, কঠিন হলো transition বোঝা। Uptrend-এর consolidation distribution মনে হতে পারে; bear-market rally-কে নতুন bull market ভাবা যায়। Accumulation, markup, distribution ও markdown—চার phase তথ্য সাজাতে সাহায্য করে; এটি descriptive framework, Bitcoin protocol rule নয় এবং live market নিজে label দেয় না।
Phase বিচার শুধু social sentiment বা এক indicator দিয়ে করা উচিত নয়। এই guide evidence-কে তিন layer-এ ভাগ করে: price structure, on-chain profit-loss ও holder supply। অন্তত দুই layer একই দিকে বদলালে phase hypothesis তুলনামূলক শক্ত হয়।
Contents
- Framework: চার phase-এর কাজ ও সীমা
- Accumulation: প্রথম phase
- Markup: দ্বিতীয় phase
- Distribution: তৃতীয় phase
- Markdown: চতুর্থ phase
- Real case: 2019–2022 cycle replay
- Free data: download and calculate
- Conflict rules: evidence disagreement
- Evidence: তিন layer confirmation
- Profit metrics: MVRV, NUPL ও SOPR
- Holder supply: LTH/STH ব্যবহার
- Invalidation: phase hypothesis কখন ভুল
- Worksheet: weekly cycle review
- Mistakes: সাধারণ ভুল
- FAQ: প্রায়শ জিজ্ঞাসিত প্রশ্ন
- Sources: উৎস ও ঝুঁকি ঘোষণা
Framework: চার phase-এর কাজ ও সীমা
চার phase:
- Accumulation: long decline-এর পর balance; sell pressure আর ধারাবাহিকভাবে dominate করে না।
- Markup: demand supply absorb করে; higher high ও higher low তৈরি হয়।
- Distribution: high level-এ supply-demand contest; old holder spend বাড়াতে পারে, new demand তা absorb করে।
- Markdown: supply demand-এর চেয়ে বেশি; lower high ও lower low হয়।
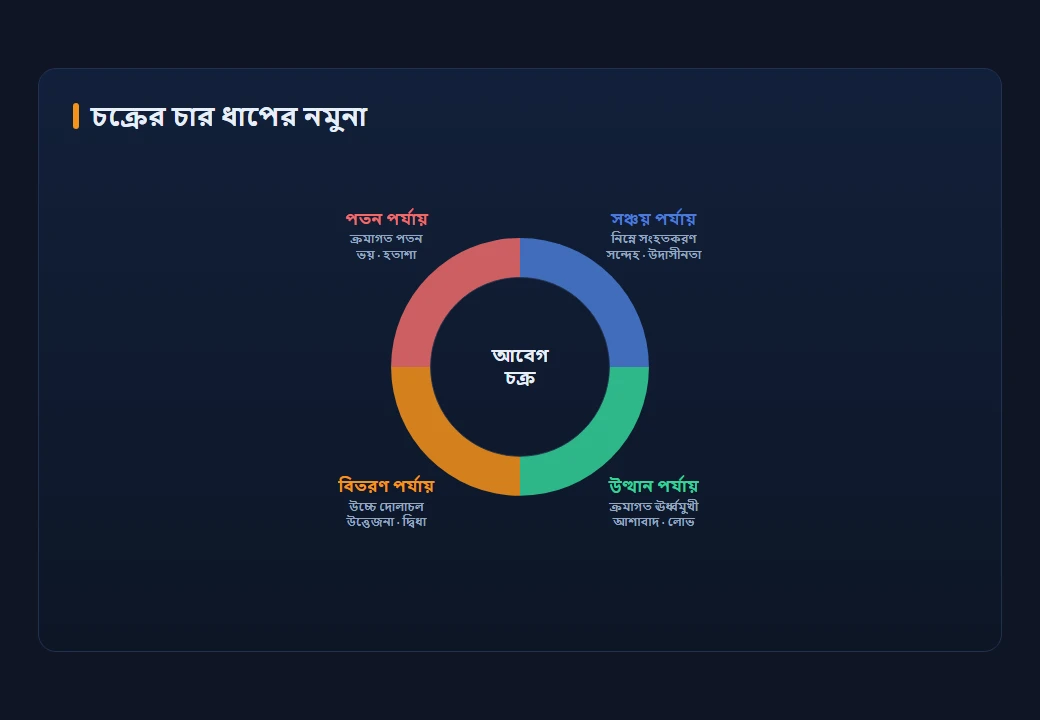
এর value common language, date prediction নয়। Market phase skip, extend, repeat বা false reversal করতে পারে। এক timeframe-এ markup, shorter timeframe-এ markdown হতে পারে। Phase label-এর সঙ্গে timeframe ও invalidation condition লিখুন।
Accumulation: প্রথম phase
Accumulation long decline-এর পরে হতে পারে, কিন্তু “cheap price” বা “whale buying” অনুভূতি দিয়ে বলা যায় না।
Price layer
- Weekly price ধারাবাহিক new low করা বন্ধ করে; breakdown reclaim করে।
- Capitulation event-এর পর volume ও volatility ঠান্ডা হয়।
- Bad news থাকলেও marginal price impact কমে।
Profit-loss layer
- MVRV 1-এর কাছে বা নিচে থাকলে market value model-এর aggregate on-chain cost-এর কাছে বা নিচে। ইতিহাসে late bear phase-এর সঙ্গে overlap করেছে, fixed buy signal নয়।
- NUPL negative থেকে আর খারাপ না হয়ে stabilize করলে unrealized loss pressure কমতে পারে।
- SOPR 1-এর নিচে হলে moved coin গড়ে loss realize করে; 1-এর দিকে ফেরা break-even-এর কাছে আসার clue।
Supply layer
LTH supply trend বাড়া ও STH supply কমা বেশি coin dormant হওয়ার ইঙ্গিত দিতে পারে। Coin age স্বাভাবিকভাবে বাড়লেও LTH বাড়ে; “smart money bought today” বলা যাবে না।
Bear-market bottom signals guide-এ বিস্তারিত আছে।
Markup: দ্বিতীয় phase
Markup এক দিনের pump নয়; demand একটি সময় ধরে supply-এর ওপর থাকে।
Price layer
- Weekly higher high ও higher low।
- Pullback previous important zone-এর ওপরে hold করে।
- Breakout-এর পরে volume ও follow-through থাকে; সঙ্গে সঙ্গে range-এ ফেরে না।
Profit-loss layer
MVRV সাধারণত 1-এর ওপরে যায়, NUPL positive ও rising হয়—aggregate unrealized profit বাড়ে। Pullback-এ SOPR 1-এর কাছে reset হয়ে recover করা profit-taking pause ও renewed absorption-এর সঙ্গে মেলতে পারে। এগুলো historical relationship, mechanical trade signal নয়।
Supply layer
New demand এলে STH supply বাড়তে পারে। LTH old coin spend শুরু করলেই bearish নয়; early markup-এ moderate distribution market liquidity ফিরিয়ে দিতে পারে। Demand absorb করছে কি না দেখুন।
Trend smooth লাগায় position বাড়িয়ে যাওয়া common risk। Position stress test বজায় রাখুন।
Distribution: তৃতীয় phase
Distribution hindsight-এ সবচেয়ে পরিষ্কার। High-level volatility supply demand ছাড়াচ্ছে—এমনও হতে পারে, আবার markup consolidation-ও হতে পারে।
Price layer
- Multiple high হয়, কিন্তু follow-through কমে; breakout দ্রুত reclaim হয়।
- Volatility বাড়ে, positive news-এর marginal gain ছোট হয়।
- Top এক দিন নয়; কয়েক সপ্তাহ বা মাসের range হতে পারে।
Profit-loss layer
MVRV ও NUPL relative high-এ থাকলে large unrealized profit sell incentive বাড়ায়। কিন্তু cycle extreme বদলাতে পারে; fixed color বা threshold ধরে থাকবেন না।
Supply layer
LTH spending ও STH supply expansion old-to-new holder transfer বোঝাতে পারে। Supply বাড়লেও price rise করলে demand absorb করছে; new demand-এর price effect দুর্বল হলে distribution hypothesis শক্ত হয়।
একবারে top call না করে staged profit taking ও rebalancing দিয়ে concentration কমান।
Markdown: চতুর্থ phase
Markdown-এ lower high ও lower low হয়; rebound previous range reclaim করতে পারে না। Deleveraging, profit erosion ও late-stage realized loss দেখা যেতে পারে।
Price layer
- Key support break-এর পর rebound তা reclaim করতে ব্যর্থ।
- Positive news reaction short, negative news নতুন low সহজ করে।
- Low liquidity-তে price ও volume violently move করতে পারে।
Profit-loss layer
NUPL নিচে যায় বা negative হয়, MVRV 1-এর দিকে বা নিচে, SOPR বারবার 1-এর নিচে—unrealized ও realized loss বাড়ে। Extreme pessimism দীর্ঘ হতে পারে; direct bottom signal নয়।
Supply layer
STH সাধারণত high loss ও volatility sensitivity বহন করে। LTH supply ধীরে বাড়তে পারে, আবার stress event-এ old-coin capitulation-ও হতে পারে। Single-day value নয়, trend ও price reaction দেখুন।
Real case: 2019–2022 cycle replay
নিচের table history-কে জোর করে চার ভাগ করে না। প্রতিটি data cutoff-এ তখন কী জানা যেত এবং কী জানা যেত না দেখায়। Price, MVRV ও active address একই Coin Metrics UTC daily source থেকে; LTH/STH ratio CoreCharts-এর 155-day soft model। Soft model Glassnode entity-adjusted version নয়; absolute value একসঙ্গে মেশাবেন না।
Calculation:
- 30/90-day price change = cutoff PriceUSD ÷ আগের PriceUSD − 1;
- 200-day average distance = cutoff PriceUSD ÷ previous 200 complete daily average − 1;
- NUPL = 1 − 1 ÷ MVRV; তাই derived NUPL ও MVRV একই evidence family;
- active-address change = recent 30-day AdrActCnt average ÷ previous 30-day average − 1;
- LTH/STH ratio 90-day change = cutoff ratio ÷ 90-day-earlier ratio − 1।
| Cutoff | 30d / 90d price | 200DMA distance | MVRV / derived NUPL | Active address 30d avg change | LTH/STH ratio 90d change | তখনকার hypothesis |
|---|---|---|---|---|---|---|
| 2019-02-01 | −11.62% / −45.60% | −38.01% | 0.780 / −0.282 | −0.61% | −26.88% | Accumulation candidate; price recovery ও supply confirmation নেই |
| 2019-04-02 | +29.65% / +25.79% | +6.14% | 1.129 / +0.114 | +7.66% | −0.25% | Post-accumulation transition candidate; price ও activity improve |
| 2020-12-16 | +27.64% / +95.41% | +74.75% | 2.704 / +0.630 | +8.38% | −21.28% | Markup price ও activity layer-এ confirmed |
| 2021-11-08 | +22.78% / +48.48% | +48.43% | 2.855 / +0.650 | +6.01% | +28.86% | Distribution candidate মাত্র; ওই দিনের data top প্রমাণ করে না |
| 2022-01-22 | −30.99% / −42.50% | −28.15% | 1.455 / +0.313 | −3.50% | +2.90% | Structure break; distribution end / markdown transition confirmed |
| 2022-06-18 | −37.16% / −53.96% | −52.21% | 0.840 / −0.191 | −7.66% | −0.73% | Deep markdown; তবু bottom ঘোষণা নয় |
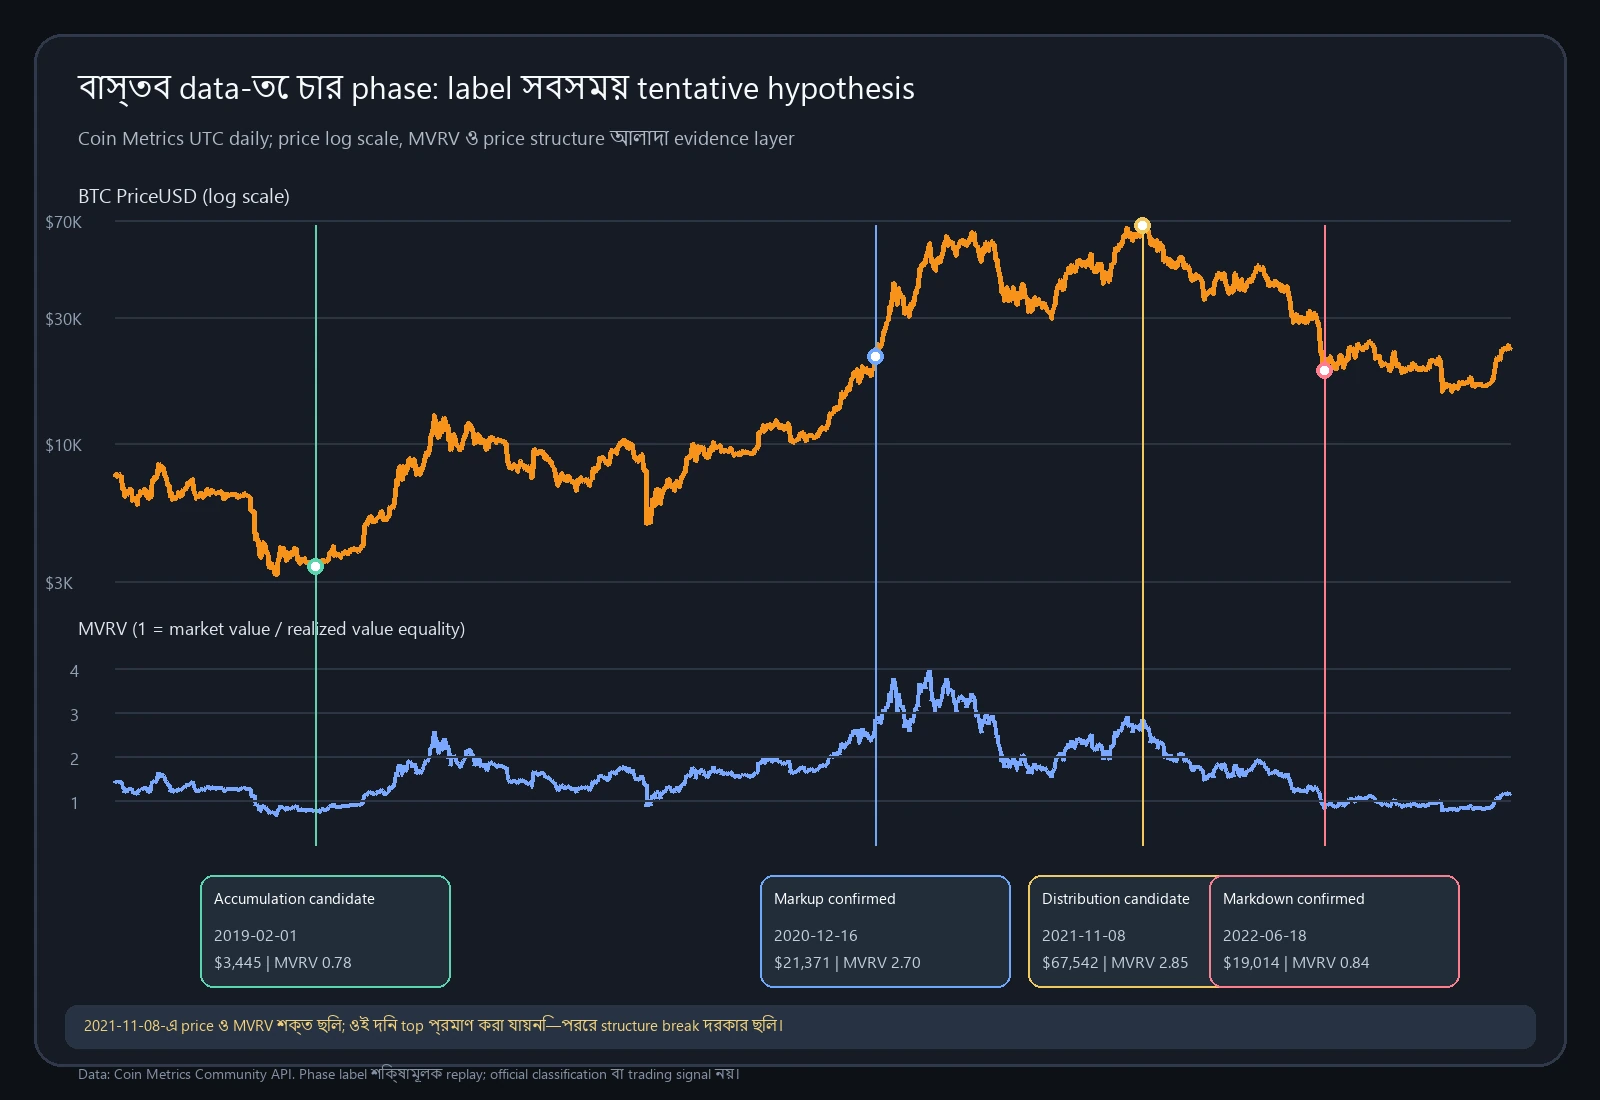
Replay-এর মূল lesson confirmation delay। 2021-11-08 পরে window high হয়েছে, কিন্তু ওই দিন price 200DMA-এর 48.43% ওপরে, 30/90-day return positive, MVRV ও active address-ও collapse দেখায়নি। Subsequent breakout failure ও 2022-01-22 structure break-এর পরে distribution hypothesis-এর confidence বাড়ানো যেত।
একইভাবে 2019-02-01 MVRV 1-এর নিচে ও NUPL negative শুধু valuation/loss background দেয়; accumulation নিশ্চিত করে না। 2019-04-02-এ price 200DMA-এর ওপরে, 30/90-day change এবং active address improve করার পরে transition hypothesis independent support পায়।
Evidence: তিন layer confirmation
| Evidence layer | প্রশ্ন | Data |
|---|---|---|
| Price structure | High-low direction কি টেকসই? Breakout hold করছে? | Weekly price, volume, volatility, news reaction |
| On-chain profit-loss | Aggregate profit না loss? Spending loss realize করছে? | MVRV, NUPL, SOPR |
| Holder supply | Old ও new coin supply কীভাবে বদলাচ্ছে? | LTH/STH supply ও spending trend |
Highly correlated metric-কে independent evidence বলবেন না। MVRV ও NUPL দুটোই Realized Cap ব্যবহার করে; দুটো দুর্বল হলে profit-loss layer শক্ত হয়, কিন্তু price বা supply layer confirmation এখনও দরকার।
Profit metrics: MVRV, NUPL ও SOPR
- MVRV: Market Cap বনাম Realized Cap; aggregate on-chain cost-এর তুলনায় market position।
- NUPL: Net unrealized profit-loss; network paper gain বা loss কতটা।
- SOPR: ওই period-এ spent output গড়ে profit না loss realize করেছে।
Time concept আলাদা: MVRV/NUPL stock state, SOPR current spending flow। “State + behavior” মিলিয়ে দেখুন—aggregate loss-এর সময় realized loss বাড়ছে, না equilibrium-এর দিকে যাচ্ছে।
Holder supply: LTH/STH ব্যবহার
Glassnode প্রায় 155 দিন ও smoothing model দিয়ে LTH/STH classify করে এবং entity clustering ব্যবহার করে। Limitations:
- Statistical cohort, real identity বা skill rank নয়।
- Age threshold cross করলে class বদলায়; ওই দিন buy হয়নি।
- Coin move transfer, custody change বা sale হতে পারে।
- Exchange internal trade সরাসরি on-chain নাও দেখা যেতে পারে।
Weeks-to-months supply direction দেখুন; one-day change দিয়ে cycle call করবেন না। LTH/STH supply guide দেখুন।
Invalidation: phase hypothesis কখন ভুল
- Accumulation hypothesis: price আবার sustained new low, loss বাড়ে, sell pressure blunt হয় না।
- Markup hypothesis: breakout দ্রুত fail, weekly lower high ও lower low।
- Distribution hypothesis: increased supply শক্ত demand absorb করে, price stable new high করে।
- Markdown hypothesis: key range reclaim, sustained higher low এবং profit-supply data improve।
Entry বা reduction-এর আগে invalidation লিখুন; move হওয়ার পরে definition বদলাবেন না।
Free data: download and calculate
একই cutoff data নিন
- Fixed Coin Metrics query খুলুন। Live analysis-এ end_time শেষ complete UTC daily row দিন এবং অন্তত 290 days রাখুন, যাতে 200DMA ও 90-day change হিসাব হয়।
- PriceUSD, CapMVRVCur, AdrActCnt নিন। Missing day-কে zero করবেন না; nearest prior complete day বা missing label ব্যবহার করুন।
- CoreCharts LTH/STH soft ratio API থেকে same date ও 90 days earlier value নিন। Method soft model লিখুন; entity-adjusted vendor value-এর সঙ্গে splice করবেন না।
- API URL, query time, UTC timezone, formula ও unrounded value রাখুন; display-এ শেষে round করুন।
Price layer আগে লিখুন
- 30/90-day return ও 200DMA distance হিসাব করুন;
- weekly recent দুই high ও low দেখুন, শুধু এক দিন নয়;
- breakout hold করেছে বা breakdown reclaim করেছে কি না লিখুন;
- sustained structure ছাড়া “confirmed” নয়—candidate বা transition লিখুন।
Profit ও activity layer
- MVRV ও derived NUPL এক evidence layer;
- MVRV below 1 automatic buy নয়; high MVRV automatic top নয়;
- AdrActCnt active address count, unique user, volume বা buy demand নয়। Activity improve/decline context দেয়।
Supply layer শেষে
- LTH/STH ratio rising coin aging থেকেও হতে পারে; long-term holder আজ buy করেছে প্রমাণ নয়;
- falling ratio old-coin spending, short-term supply growth বা model classification হতে পারে;
- single-day jump নয়, 30/90-day trend ও price reaction দেখুন।
Final output: timeframe → tentative phase → confidence → supporting evidence → contrary evidence → invalidation → next review date। Contrary evidence ছাড়া phase name complete analysis নয়।
Conflict rules: evidence disagreement
| Price | Profit/activity | Supply | Tentative handling |
|---|---|---|---|
| Strong | Strong | Old-coin spending rises | Late markup/distribution candidate; structure break ছাড়া top confirmed নয় |
| Weak | MVRV near/below 1, activity improves | Ratio falls | Accumulation candidate; higher low বা key-range reclaim অপেক্ষা |
| Weak | Profit-loss worsens | LTH/STH ratio rises | Coin aging হতে পারে; markdown/unclear বজায় রাখুন |
| Strong | Profit improves | Activity lags | Markup candidate, lower confidence; thin liquidity check করুন |
| Mixed | Mixed | No trend | Transition/unclear; action frequency কমান |
Phase vote count নয়। Related metric একই underlying change reflect করতে পারে। Price structure, on-chain profit, activity ও coin-age supply-এর dependency লিখুন। Data missing হলে “unclear” সঠিক answer; closest label বানাবেন না।
Worksheet: weekly cycle review
প্রতি সপ্তাহে একই সময়—যেমন last complete UTC daily row-এর পরে—fill করুন:
| Field | This week | Previous | 4-week direction | Interpretation |
|---|---|---|---|---|
| PriceUSD | ||||
| 30d / 90d return | ||||
| 200DMA ও distance | ||||
| Recent weekly highs/lows | ||||
| MVRV | ||||
| Derived NUPL | Same MVRV evidence family | |||
| AdrActCnt recent 30d avg | Unique user নয় | |||
| LTH/STH soft ratio | Method mix নয় | |||
| Major news-এর পরে price reaction |
Conclusion:
- Timeframe ও data cutoff;
- Tentative phase: accumulation candidate / markup / distribution candidate / markdown / transition / unclear;
- Confidence: low / medium / high ও কারণ;
- অন্তত এক independent price evidence এবং এক non-price evidence;
- অন্তত এক contrary evidence;
- Exact price/data condition যা hypothesis invalidate করবে;
- Action: unchanged / reduce risk / pause additions / planned rebalance;
- Next review date।
Risk-management worksheet position ঠিক করবে; staged profit-taking plan exit execute করবে। Phase context prewritten loss limit override করতে পারবে না।
Mistakes: সাধারণ ভুল
- Sideways মানেই accumulation: high-level range distribution হতে পারে।
- New high মানেই early markup: distribution-এর final breakout হতে পারে।
- Pessimism মানেই bottom: হতাশা দীর্ঘ হতে পারে, price আরও পড়তে পারে।
- LTH increase মানেই whale buy: coin age ও model classification প্রভাব ফেলে।
- Halving-এর পরে fixed-date bull: halving শুধু new supply বদলায়; demand ও macro condition জরুরি।
- Phase সবসময় serial: false breakout, fast reversal ও repeated test হয়।
FAQ: প্রায়শ জিজ্ঞাসিত প্রশ্ন
এখন কোন phase?
এই article live call দেয় না। Data cut-off ও timeframe লিখে অন্তত দুই evidence layer ব্যবহার করুন; conflict হলে transition/unclear লিখুন।
Four phase ও four-year cycle কি একই?
না। Four phase market-behavior framework; four-year cycle প্রায় চার বছরের halving rhythm থেকে আসে। Price phase exact halving date follow করতে বাধ্য নয়।
Best turning-point indicator কোনটি?
একটি নেই। Price, profit-loss ও holder supply আলাদা প্রশ্নের উত্তর দেয়; প্রতিটিতে invalidation দরকার।
Emotion কি data দিয়ে মাপা যায়?
NUPL/SOPR profit-loss context দেয়; প্রতিটি মানুষের emotion সরাসরি পড়ে না।
Sources: উৎস ও ঝুঁকি ঘোষণা
- Coin Metrics API v4 ও fixed case query: PriceUSD, MVRV ও active-address daily data।
- CoreCharts LTH/STH soft-model docs ও ratio API: free 155-day soft-model ratio; entity-adjusted version নয়।
- Glassnode: MVRV Ratio: market value, realized value ও historical cycle interpretation যাচাই।
- Glassnode: NUPL: net unrealized profit-loss formula যাচাই।
- Glassnode: SOPR: realized profit-loss ও value 1 যাচাই।
- Glassnode: LTH/STH Supply: 155-day cohort ও supply transfer যাচাই।
- FINRA: Crypto Assets — Risks: volatility, liquidity ও total-loss risk যাচাই।
শুধু educational information; investment advice নয়। Four-phase model hindsight organization ও risk communication framework; market serially repeat করবে বা exact turn predict করবে—এমন guarantee নেই।