
চক্রের মূলনীতি
Bitcoin diminishing returns বাংলা: চার halving-এর real data
চারটি halving block ও Coin Metrics daily PriceUSD দিয়ে একই 18-month window-এর peak ও ending multiple হিসাব করুন; endpoint bias, CAGR, incomplete cycle ও invalidation বুঝুন।

“প্রতি Bitcoin cycle-এ return কমবেই”—বাক্যটি law-এর মতো শোনালেও start, end ও observation window নির্ধারণ ছাড়া এটি পরীক্ষা করা যায় না। কেউ যদি hindsight দিয়ে প্রতিটি cycle-এর lowest ও highest price বেছে নেয় কিন্তু endpoint rule না বলে, পাঠক result reproduce করতে পারবেন না এবং historical pattern-কে future ceiling মনে করতে পারেন।
এই guide চারটি halving block-এর বাস্তব UTC time ও Coin Metrics daily PriceUSD ব্যবহার করে প্রতিটি halving date থেকে একই 18-month window তুলনা করে। একটি result window-এর highest price multiple, অন্যটি 18 মাসের শেষ দিনের multiple। শেষে আপনি raw data নিতে, multiple ও return পুনরায় হিসাব করতে, endpoint বদলের প্রভাব বুঝতে এবং claim-এর support, contrary evidence ও invalidation লিখতে পারবেন।
এটি data-analysis tutorial, price forecast বা investment advice নয়। Historical multiple কমেছে বলে ভবিষ্যতেও বাধ্যতামূলকভাবে কমবে না; এখান থেকে target price বানানো ঠিক নয়।
সূচিপত্র
- return কমার claim-কে testable করুন
- data convention ও চারটি halving time স্থির করুন
- একই 18-month window পুনরায় হিসাব করুন
- চারটি result-এর সম্পূর্ণ calculation
- endpoint বদলালে উত্তর বদলায় কেন
- CAGR ও peak-to-peak কীভাবে ব্যবহার করবেন
- দেখা pattern কী ব্যাখ্যা করতে পারে আর কী পারে না
- 2024 cycle কীভাবে label করবেন
- target price নয় risk decision-এ ব্যবহার
- invalidation ও analysis record
- সাধারণ ভুল
- সাধারণ প্রশ্ন
- উৎস ও যাচাই
return কমার claim-কে testable করুন
কমপক্ষে চারটি আলাদা claim-কে প্রায়ই “cycle return diminishing” বলা হয়:
- প্রতিটি cycle low থেকে high multiple কমে;
- halving date থেকে cycle high multiple কমে;
- প্রতিটি halving-এর পরে একই holding-period return কমে;
- long-term annualized return কমে।
এগুলোর endpoint, holding time ও hindsight bias আলাদা; একই table-এ মেশানো যাবে না। এই article মূলত তৃতীয় claim পরীক্ষা করে এবং একই window-এর highest multiple-ও report করে:
প্রশ্ন: প্রতিটি halving date-এর পর প্রথম 18 মাসে BTC-র highest-price multiple এবং 18-month ending multiple কি পরপর কমেছে?
18 মাস কোনো magic number নয়। চার cycle-কে একই prewritten observation length-এ তুলনা করার জন্য এটি নেওয়া হয়েছে এবং আগের তিন cycle-এর আলোচিত post-halving rise ধরা পড়ে। 12, 24 বা 48 মাস নিলে result বদলাতে পারে; window নিজেই methodology-এর অংশ।
data convention ও চারটি halving time স্থির করুন
Bitcoin Core mainnet parameter subsidy-halving interval 210,000 blocks নির্ধারণ করে; ঠিক চার calendar year নয়। mempool.space দিয়ে block UTC time যাচাই করা হয়েছে:
| Halving | Block height | Block UTC time | Daily start | 18-month end |
|---|---|---|---|---|
| প্রথম | 210,000 | 2012-11-28 15:24:38+00:00 | 2012-11-28 | 2014-05-28 |
| দ্বিতীয় | 420,000 | 2016-07-09 16:46:13+00:00 | 2016-07-09 | 2018-01-09 |
| তৃতীয় | 630,000 | 2020-05-11 19:23:43+00:00 | 2020-05-11 | 2021-11-11 |
| চতুর্থ | 840,000 | 2024-04-20 00:09:27+00:00 | 2024-04-20 | 2025-10-20 |
Price data হলো Coin Metrics Community API-এর PriceUSD, frequency 1d, timezone UTC। Daily value কোনো নির্দিষ্ট exchange-এর intraday high-low বা আপনার execution price নয়। চারটি period-এ একই source, field, timezone ও frequency ব্যবহার না করলে difference market-এর বদলে data convention থেকে আসতে পারে।
একই 18-month window পুনরায় হিসাব করুন
Fixed Coin Metrics daily query খুলে প্রতিটি period-এর জন্য:
- halving date-এর PriceUSD নিন—P₀;
- halving date থেকে 18-month end পর্যন্ত rows রাখুন;
- window-এর highest PriceUSD ও date নিন—Pmax;
- 18-month ending date-এর PriceUSD নিন—Pend;
- peak ও end multiple হিসাব করুন;
- multiple থেকে 1 বাদ দিয়ে simple return বের করুন;
- API URL, query date, UTC timezone ও precision সংরক্ষণ করুন।
Formula:
Window peak multiple = Pmax ÷ P₀
Window peak simple return = Pmax ÷ P₀ − 1
18-month end multiple = Pend ÷ P₀
18-month end simple return = Pend ÷ P₀ − 1
2020 example: P₀ = US$8,591.6529; window high হলো 2021-11-08-এর US$67,541.7555।
- Peak multiple = 67,541.7555 ÷ 8,591.6529 = 7.8613×;
- Peak return = 7.8613 − 1 = 686.13%;
- End PriceUSD = US$64,962.9313;
- End multiple = 64,962.9313 ÷ 8,591.6529 = 7.5612×;
- End return = 656.12%।
7.86× multiple মানে +686%, +786% নয়। Multiple ও return গুলিয়ে ফেলা খুব সাধারণ error।
চারটি result-এর সম্পূর্ণ calculation
| Halving | Start PriceUSD | 18 মাসের highest date ও price | Peak multiple | Peak return | End PriceUSD | End multiple | End return |
|---|---|---|---|---|---|---|---|
| 2012 | 12.3317 | 2013-12-04; 1,134.9322 | 92.0340× | 9,103.40% | 579.1893 | 46.9677× | 4,596.77% |
| 2016 | 651.9419 | 2017-12-16; 19,640.5139 | 30.1262× | 2,912.62% | 14,378.5862 | 22.0550× | 2,105.50% |
| 2020 | 8,591.6529 | 2021-11-08; 67,541.7555 | 7.8613× | 686.13% | 64,962.9313 | 7.5612× | 656.12% |
| 2024 | 64,907.9928 | 2025-10-06; 124,824.4537 | 1.9231× | 92.31% | 110,640.2495 | 1.7046× | 70.46% |
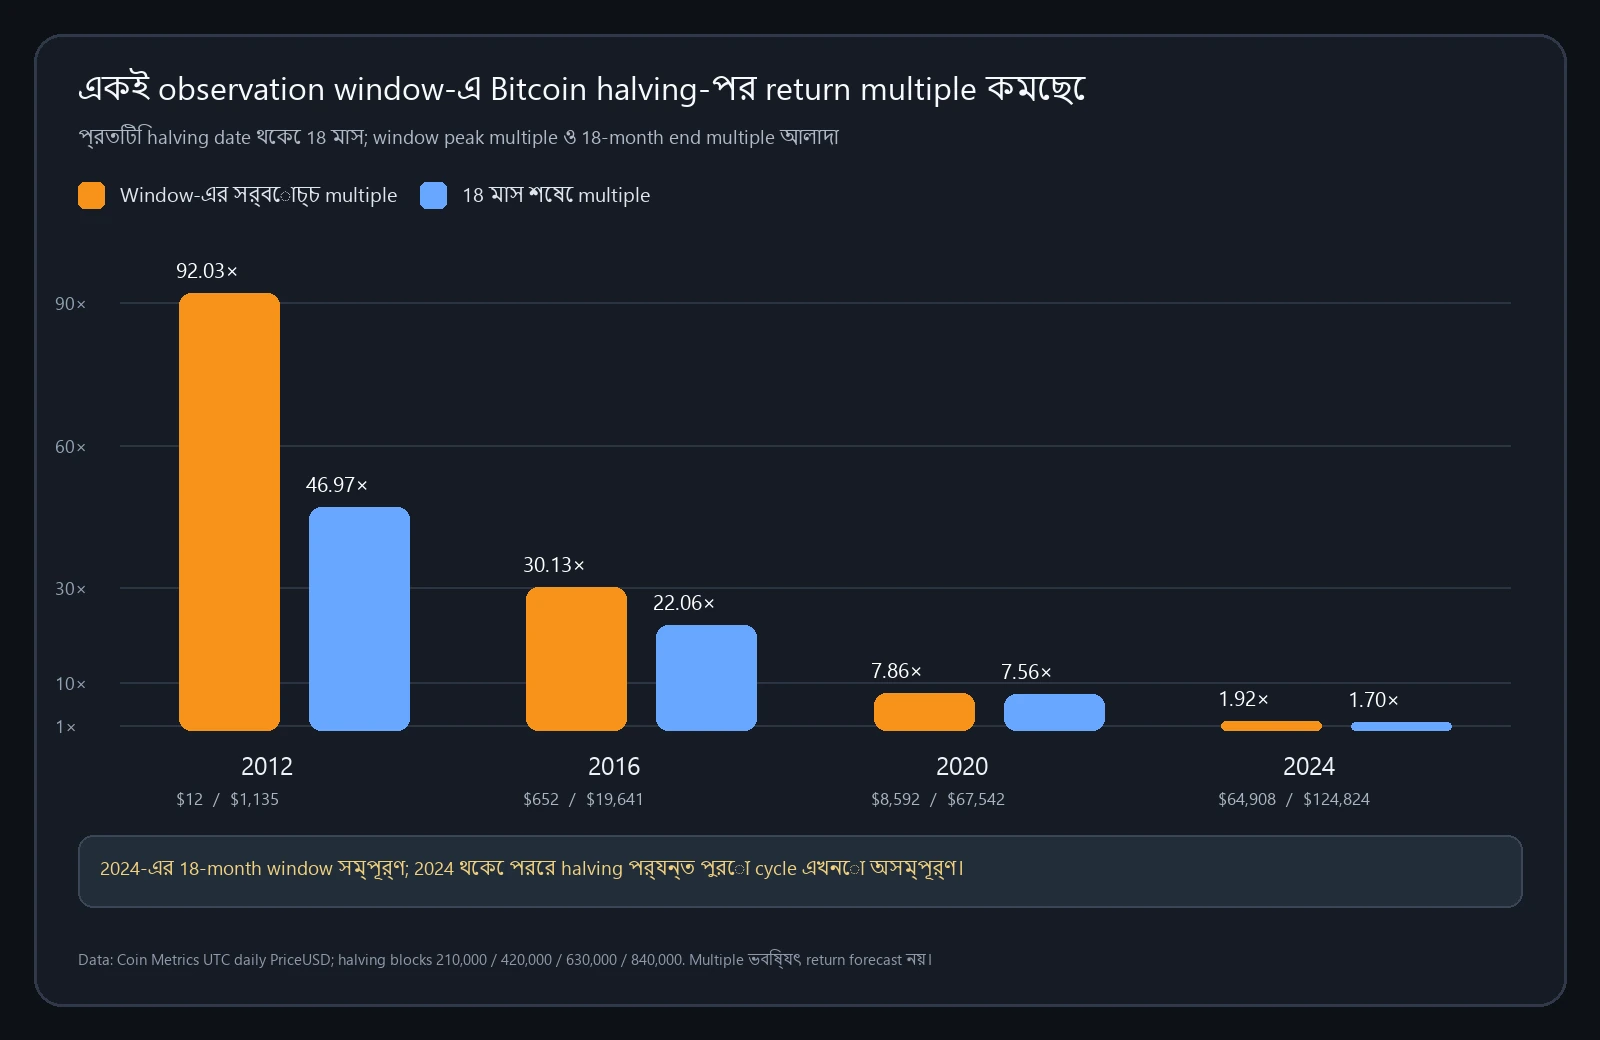
এই নির্দিষ্ট, একই এবং সম্পূর্ণ 18-month convention-এ peak ও end multiple দুটোই cycle অনুযায়ী কমেছে। Data observed diminishing multiple support করে; কিন্তু sample মাত্র চারটি এবং protocol ভবিষ্যৎ return কমতেই হবে এমন guarantee দেয় না।
endpoint বদলালে উত্তর বদলায় কেন
Low-to-high
এতে সবচেয়ে বড় multiple দেখা যায়, কিন্তু low ও high hindsight ছাড়া জানা যায় না। Author intraday price, daily value, আলাদা exchange বা cycle boundary বেছে নিলে result বদলায়। Historical range বোঝাতে পারে; executable strategy নয়।
Halving-to-peak
Start objective, end এখনো hindsight maximum। তাই এই article peak result-এর পাশাপাশি fixed ending result দেখায়—শুধু সুন্দর result নয়।
Fixed holding period
Start ও end আগে লেখা যায়; cross-cycle comparison বেশি fair। অসুবিধা: 12, 18 ও 24 মাসে আলাদা answer আসতে পারে। Result দেখার পরে window বদলানো চলবে না।
Peak-to-peak
সহজ মনে হলেও peak definition outcome বদলায়। “প্রতিটি halving interval-এর maximum daily value” ধরলে 2020–2024 interval-এর maximum 2024-03-13-এ, 2021-এ নয়—কারণ পরের halving-এর আগেই নতুন high হয়েছিল। Market সবসময় পরিষ্কার bull-bear calendar মানে না।
CAGR ও peak-to-peak কীভাবে ব্যবহার করবেন
Holding days আলাদা হলে total multiple সরাসরি তুলনা করা ঠিক নয়। Compound annual growth rate:
CAGR = (ending value ÷ starting value)^(365.2425 ÷ holding days) − 1
CAGR শুধু start-to-end return annualize করে; মাঝের drawdown, volatility, liquidity, tax বা endpoint-এ execution সম্ভব ছিল কি না দেখায় না। এখানে period প্রায় একই 18 মাস, তাই simple multiple-ই তুলনার জন্য যথেষ্ট। Unequal low-to-high বা peak-to-peak period ব্যবহার করলে days ও CAGR দুটোই report করুন।
Analysis sheet-এ method, start rule, end rule, date, days, start value, end value, multiple, simple return, CAGR, source এবং hindsight extreme ব্যবহার হয়েছে কি না লিখুন। একটি বাদ পড়লে independent reproduction দুর্বল হয়।
দেখা pattern কী ব্যাখ্যা করতে পারে আর কী পারে না
Diminishing multiple-এর সম্ভাব্য explanation আছে; কিন্তু price table একা causal proof নয়:
- Larger base: একই percentage increase-এ বড় market-value change হয়; কিন্তু market cap increase একই পরিমাণ net capital inflow নয়।
- Lower new issuance: halving নতুন BTC subsidy কমায়; price demand, holder selling, fee, miner behavior ও market structure-এর ওপরও নির্ভর করে।
- Maturing market: liquidity, derivatives ও institutional access transmission বদলাতে পারে; এগুলো volatility কমাতেও পারে, deleveraging-এ বাড়াতেও পারে।
- Small sample ও endpoint choice: মাত্র চার halving; অল্প window-এ trend অতিরিক্ত smooth দেখাতে পারে।
- Different macro conditions: interest rate, dollar liquidity, regulation ও risk appetite একই supply event-এর price response বদলায়।
Bitcoin Core subsidy rule প্রমাণ করে, price return-এর diminishing law নয়। Coin Metrics history দেখায়, causality আলাদা করে না। Mechanism, observation ও inference আলাদা রাখুন।
2024 cycle কীভাবে label করবেন
এই article-এর 2024 18-month window 2025-10-20-এ সম্পূর্ণ হয়েছে। তাই একই window comparison বৈধ। কিন্তু block 840,000 থেকে পরের halving পর্যন্ত সম্পূর্ণ epoch এখনো শেষ হয়নি।
সঠিক statement:
- “2024 halving-এর প্রথম 18 মাসে peak multiple 1.9231× এবং ending multiple 1.7046×”;
- “2024 থেকে পরের halving পর্যন্ত পুরো cycle-এর final high, return ও peak date এখনো অজানা।”
ভুল statement: 18-month maximum-কে “cycle final top” বলা, বা unfinished full epoch-কে past complete epoch-এর সঙ্গে তুলনা করে law নিশ্চিত ঘোষণা করা।
target price নয় risk decision-এ ব্যবহার
Diminishing-return study expectation constrain করতে পারে; precise sell price দেয় না। ব্যবহার করুন এভাবে:
- আগের cycle multiple repeat হবে ধরে budget বানাবেন না;
- low return, long sideways period ও deep drawdown stress test করুন;
- position potential multiple দিয়ে নয়, acceptable loss দিয়ে ঠিক করুন;
- Bitcoin risk-management worksheet দিয়ে total exposure limit করুন;
- entry ও contribution-এর জন্য আলাদা DCA rule রাখুন;
- exit-এর জন্য staged profit-taking ও fill verification ব্যবহার করুন;
- supply mechanism ও price effect আলাদা বুঝতে halving price impact এবং four-year cycle পড়ুন।
Future multiple আগেরটির চেয়ে বেশি হলেও leverage নিরাপদ হয় না; multiple আরও কমলেও Bitcoin-এর return অবশ্যই negative হবে না। এগুলো আলাদা প্রশ্ন।
invalidation ও analysis record
আপনি strong না weak claim পরীক্ষা করছেন লিখুন:
- Strong: “প্রতিটি same-window multiple আগেরটির চেয়ে কম হবে।” Future একটিও আগের cycle-এর চেয়ে বেশি হলে strict monotonic claim false।
- Weak: “Market বড় হলে long-run average multiple কমার tendency আছে।” একটি reversal পুরো tendency বাতিল নাও করতে পারে; তবে sample কম বলে confidence-ও কম।
Copyable record:
| Field | Entry |
|---|---|
| Analysis date ও timezone | |
| Claim | strict monotonic / long-term tendency / other |
| Observation window | halving date থেকে 18 মাস / other |
| Price field ও frequency | PriceUSD; 1d |
| Start rule | halving-date UTC daily value |
| End rule | fixed end / window high / other |
| প্রতিটি P₀, Pmax, Pend | |
| Multiple ও simple return | |
| Unequal period হলে CAGR | |
| Supporting evidence | |
| Contrary evidence | |
| Hindsight extreme? | yes / no |
| Incomplete-cycle label | |
| Invalidation condition | |
| API URL ও check date |
Spreadsheet-এ price manual retype না করে API JSON import বা full raw column copy করুন। Calculation-এ বেশি decimal রাখুন, display-এ শেষে round করুন।
সাধারণ ভুল
- 7.86×-কে +786% বলা; সঠিক প্রায় +686%।
- প্রতিটি period-এ আলাদা exchange, timezone বা intraday extreme ব্যবহার।
- Result দেখার পরে সুবিধাজনক start বা window বেছে নেওয়া।
- 2024-এর complete 18-month window-কে complete halving cycle বলা।
- Market-cap increase-কে net inflow বলা।
- শুধু maximum report করে fixed end ও drawdown বাদ দেওয়া।
- চার sample-এ curve fit করে exact future target বানানো।
- Historical diminishing pattern-কে বেশি position বা leverage-এর safety proof ধরা।
সাধারণ প্রশ্ন
Bitcoin diminishing returns কি সত্য?
এই article-এর same 18-month convention-এ চারটি peak ও end multiple পরপর কমেছে। Historical observation সত্য; sample ছোট ও mechanism future continuation guarantee না করায় এটি law নয়।
Cycle low-to-high কেন ব্যবহার করা হয়নি?
Low ও high hindsight দিয়ে জানা যায় এবং source অনুযায়ী endpoint বদলায়। Fixed halving start ও fixed ending বেশি reproducible এবং selection bias কম।
2024 data কি compare করা যায়?
সম্পূর্ণ হওয়া প্রথম 18-month window compare করা যায়। 2024 থেকে next halving পর্যন্ত full-cycle conclusion এখনো করা যায় না।
Multiple কমা মানে price নতুন high করবে না?
না। Starting price বেশি হলে lower multiple এবং higher absolute price একই সঙ্গে হতে পারে।
Trend দিয়ে next-cycle high predict করা যায়?
বিশ্বাসযোগ্যভাবে নয়। চার sample, endpoint choice ও macro condition exact extrapolation-এর জন্য যথেষ্ট নয়।
উৎস ও যাচাই
- Bitcoin Core mainnet parameters: nSubsidyHalvingInterval = 210000।
- mempool.space block 210,000, 420,000, 630,000, 840,000: halving block hash ও time verification entry।
- Coin Metrics API v4 documentation: PriceUSD ও timeseries query contract।
- Fixed Coin Metrics query: চারটি 18-month calculation-এর raw daily data।
- FINRA: Bitcoin Basics: Bitcoin volatility, platform ও loss risk।
Data checked: 2026-08-25। Calculation চার decimal ধরে করা হয়েছে; displayed number rounded। Public data revise হলে query date record করে আবার হিসাব করুন।